Drumbeats
Heartbeat monitoring that unifies cron, uptime, and jobs under one simple metric: the beat.
NewName Editorial
Editorial Team


Silent failures are the most expensive kind. A cron job that never runs, a queue worker stuck on a poisoned message, a scraper that returns exit 0 on an empty payload—these don't trigger alerts in traditional monitoring because they don't produce errors. They produce silence. Drumbeats, a monitoring platform that launched with the tagline "Stop silent failures," inverts the model: instead of watching for bad signals, it listens for the absence of a good one. Every successful job announces itself with a ping, and when that ping doesn't arrive, Drumbeats alerts you within seconds. It's a simple idea, but one that cuts across the fragmented world of cron, uptime, and background job monitoring—and it's wrapped in a name that tells you exactly what it does.
The beat that never comes
Drumbeats' core mechanism is the heartbeat monitor. You add a single line to your job—a curl to https://api.drumbeats.io/v1/ping/YOUR_MONITOR_ID—and Drumbeats expects that ping within a configurable window. If the ping doesn't arrive, it's a missed run. If it arrives late, it's a grace-period alert. If a start ping arrives but the success ping doesn't, it's a hung run. The signal is positive: every healthy run announces itself, and the absence of that announcement is the alert.
This is fundamentally different from polling. An HTTP probe checks your public endpoint and sees a 200 OK—but it has no idea whether your nightly invoice generator actually ran, whether your Stripe sync produced output, or whether your queue workers consumed yesterday's messages. From the outside, a healthy homepage looks identical to a backend silently dropping every billing job for the last 18 hours. Polling can't see inside your job; heartbeats can.
Log scraping has the same blind spot. Sentry and Datadog catch errors your code reported, but they have nothing to say about jobs that never ran, processes the OS killed mid-execution, or schedulers that misfired after a daylight-saving change. Silence in the log stream is indistinguishable from success—exactly the failure mode that costs the most when it goes undetected.
Drumbeats' approach also works behind firewalls and in private VPCs, because the job sends an outbound HTTP request—no inbound probing required. It survives infrastructure changes: move from EC2 to Kubernetes, and the curl line stays the same. It doesn't care which cron daemon, queue, or scheduler you use. Adoption is a single line of code per job, and the free tier covers up to 50 monitors—so you can wire up your most critical jobs in ten minutes.
Why polling and logs miss the failures that matter
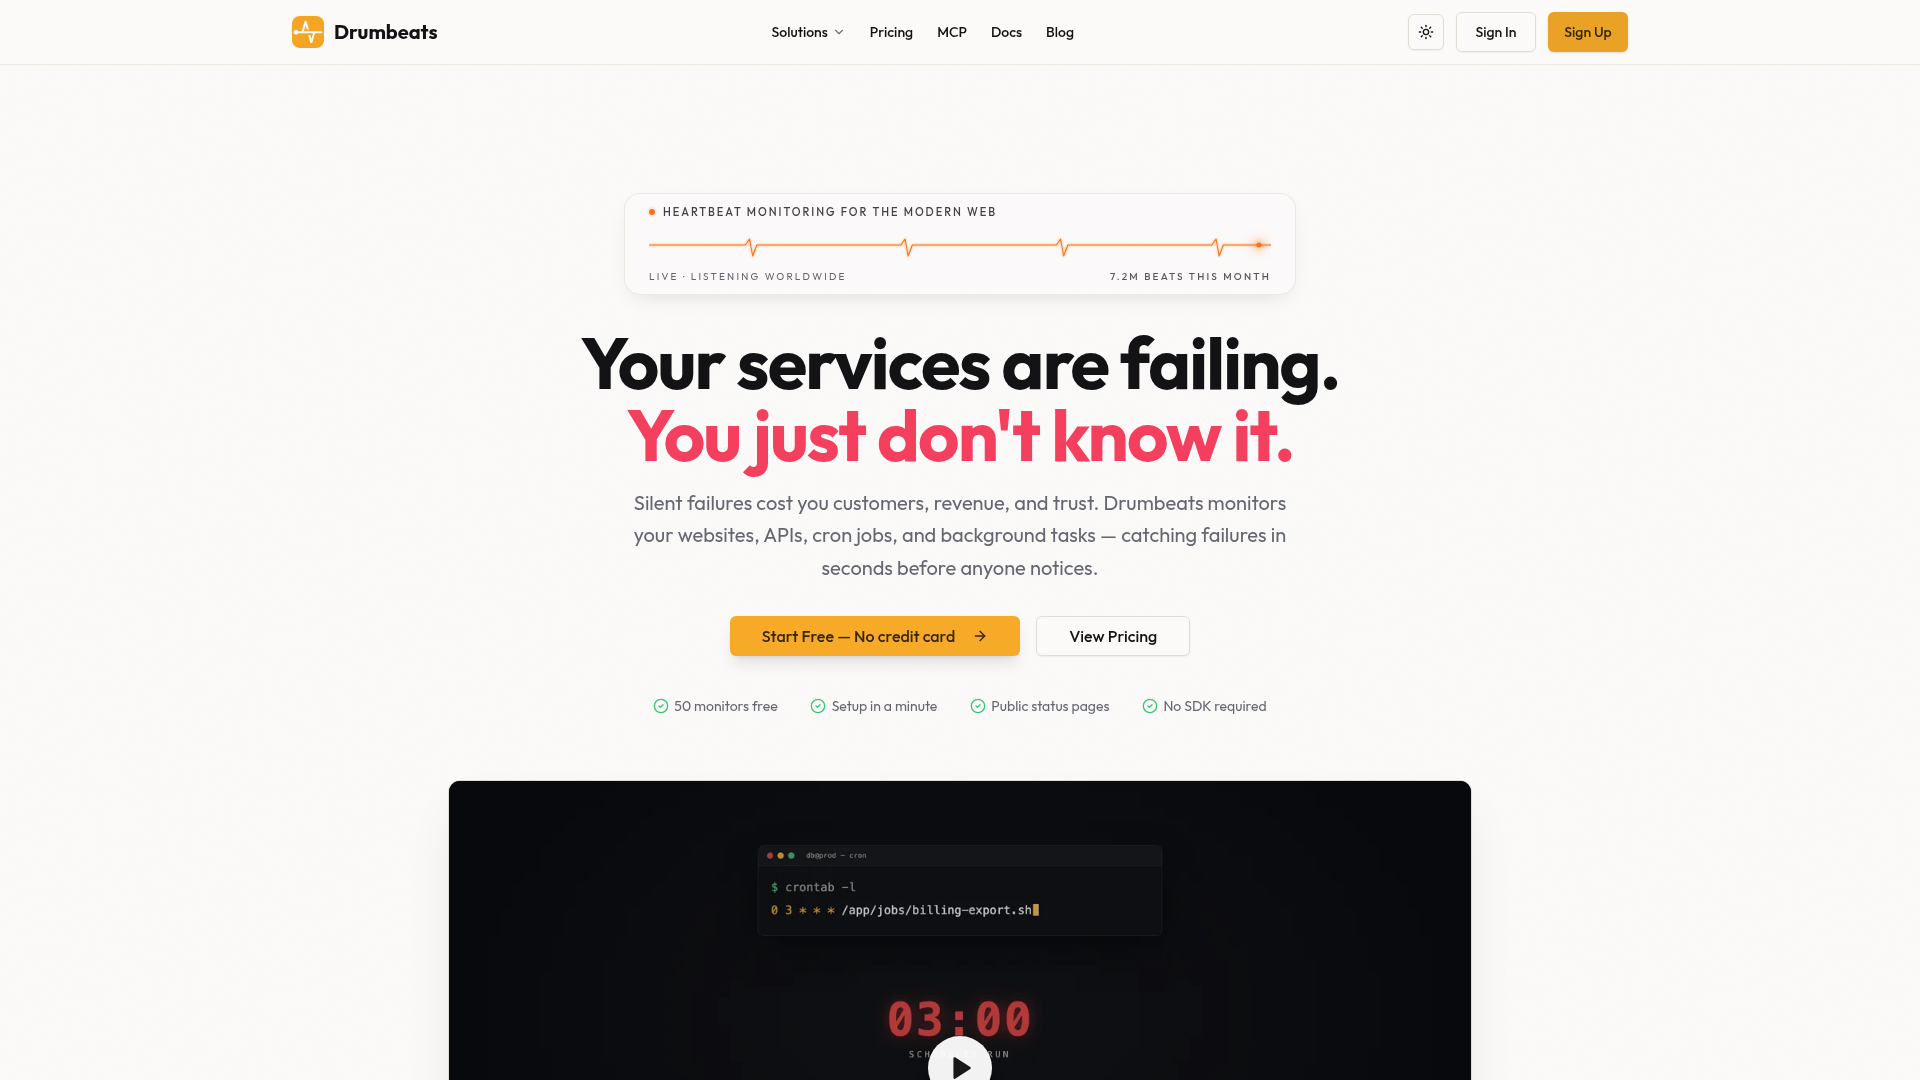
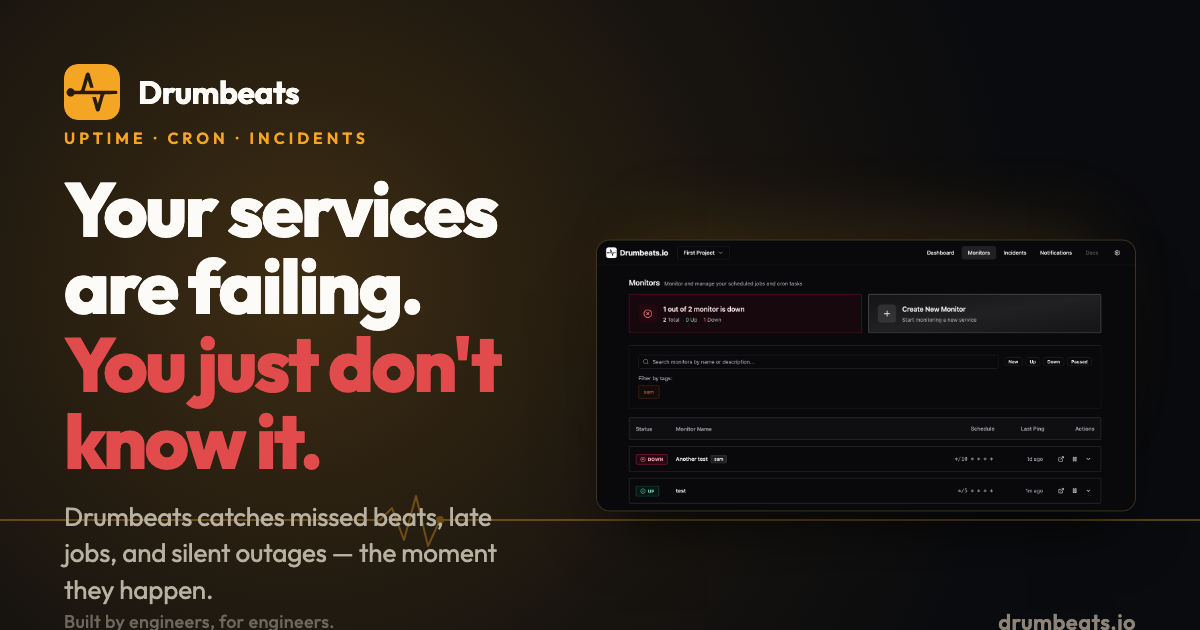
The website's copy is blunt: "Your services are failing. You just don't know it." It's a claim that resonates because it's true for most teams. The canonical example is the 2 AM pg_dump that fails silently—the "we lost three weeks of data" incident. Drumbeats fires a MISSED alert if no success ping lands within the schedule plus grace window. The same logic applies to SSL certificate renewals, ETL pipelines, queue workers, scrapers, and payment reconciliation. These are the jobs where heartbeat monitoring pays for itself in the first incident it catches.
The site lists six specific use cases, each with a code snippet showing the one-liner integration. For a scraper, the snippet is if rows>0: curl .../ping/<id>—send a success ping only when rows were actually written. This is a clever pattern: it makes the monitor check not just that the job ran, but that it produced output. For a queue worker, the heartbeat comes from inside the worker loop, catching stalls that OOM killers or poisoned messages cause with zero log output.
Drumbeats isn't just for cron jobs. It also handles uptime monitoring for websites and APIs, with HTTP checks at intervals as low as 30 seconds on paid plans. The product unifies these under one roof: cron, heartbeat, event-driven, and uptime monitors all appear in the same dashboard, with the same alerting and status page infrastructure. That's a consolidation play—replace separate vendors for cron and uptime monitoring with one tool.
One metric to rule them all: the beat
Drumbeats' pricing is built around a single usage metric called the "beat." A beat is essentially one ping—one successful job run, one HTTP check, one heartbeat. The free tier includes 200K beats per month, Pro includes 1M, and Business includes 3M. Monitors are always free; you pay for volume. This is a radical simplification compared to the per-monitor pricing of many competitors, and it aligns incentives: you only pay for what actually runs.
The beat metric also gives the product a coherent identity. It's not just a pricing unit; it's a conceptual frame. Every monitor—whether it's a cron job, a heartbeat, an uptime check, or an event-driven job—produces beats. The dashboard shows total pings processed (28,738,778 at the time of writing) and jobs monitored (1,289), reinforcing the idea that this is a system for tracking the rhythm of your infrastructure.
This unification is the product's strongest thesis. Monitoring tools have fragmented into separate categories—uptime, cron, background jobs, queue workers—each with its own vendor and its own dashboard. Drumbeats argues that they're all the same thing: scheduled or recurring work that needs to announce its health. One metric, one dashboard, one alerting pipeline.
From curl to AI: the integration spectrum
Drumbeats' integration story is refreshingly simple. No SDK, no agent, no library. A curl command is all you need, and the docs show examples in Curl, Python, Node.js, and Bash. For teams that want more structure, you can send start and success pings to track duration, and the payload can include logs or metadata (up to 100 KB on free, 1 MB on Pro, 2 MB on Business).
The more interesting angle is the AI-native design. Drumbeats offers an MCP (Model Context Protocol) server at api.drumbeats.io/mcp, which lets AI coding agents like Claude Desktop, Cursor, VS Code, and Claude Code interact with your monitors in plain language. You add the server, sign in with OAuth (no API key to mint), and then ask things like "List my monitors." This is a forward-looking move: as developers increasingly delegate operational tasks to AI agents, having a monitoring tool that speaks their language is a differentiator.
The MCP server also opens the door to AI-assisted setup. Instead of manually configuring monitors, you could theoretically ask an agent to create a monitor for a specific job. The site doesn't detail the full capabilities, but the existence of a dedicated MCP page suggests this is a strategic priority.
Naming as a thesis: Drumbeats and the rhythm of reliability
The name "Drumbeats" is a metaphor that works on multiple levels. A drumbeat is a regular, rhythmic pulse—exactly what a heartbeat monitor expects. It's also a signal that's easy to miss if it stops, which is the product's core value proposition. The name is memorable, evocative, and category-relevant without being generic. It's a far cry from the typical "-ly" or "-ify" SaaS names, and it has a personality that fits the developer-tool aesthetic.
The domain, drumbeats.io, is clean and matches the brand. The .io TLD is standard for developer tools, and the name is short enough to type and remember. The logo—a simple badge with the Drumbeats name—reinforces the brand's minimalism.
The naming also extends to the product's internal vocabulary: "beats" as the usage metric, "ping" as the action, "missed" as the alert type. This consistent metaphor makes the product easier to understand and talk about. It's a subtle but powerful branding choice.
The pricing bet: unlimited seats, metered beats
Drumbeats' pricing page makes a bold claim: "Unlimited team seats included on every plan—Free, Pro, and Business." This is a direct challenge to per-seat pricing models that penalize team growth. For a small startup, this is a huge selling point—you can add as many teammates as you want without paying extra.
The tradeoff is the beat-based usage metering. Teams that run high-frequency jobs (e.g., HTTP checks every 30 seconds) will burn through beats quickly. A single monitor checking every 30 seconds produces 2,880 beats per day, or about 86,400 per month—nearly half the free tier's 200K allowance. The pricing page is transparent about this, with a detailed breakdown of plan limits, but it's worth noting that the free tier's 50-monitor limit is generous, while the beat limit may be the binding constraint for active users.
The pricing structure is a bet that most teams' job volumes are modest, and that the simplicity of "pay for what runs" will win over the complexity of per-monitor pricing. It's a consumer-friendly approach that could disrupt the category, but it also creates a risk: power users might find the beat limits restrictive, and the cost of scaling could become unpredictable.
What Drumbeats doesn't tell you yet
Drumbeats is a young product. The website shows 28.7 million pings processed and 1,289 jobs monitored, but it doesn't disclose the number of paying customers or revenue. The founding team is small—the site credits "Lucky S Software" as the studio behind it, and the founder is Samed Kahyaoglu. There's a "Founding members" page offering a quiet thank-you for early supporters, suggesting a community-driven launch.
The product is feature-rich for its age: advanced status pages with custom branding, RSS feeds, incident timelines, and a suite of free tools like an SLA calculator and cron generator. But it's unclear how mature the alerting is—the FAQ mentions 49 questions, but the site only shows eight. The documentation is likely thorough, but I didn't have access to it.
The biggest open question is reliability. A monitoring tool that goes down is useless, and Drumbeats' own status page shows 100% uptime over the last 24 hours, but that's a short window. The company is also young, and the long-term viability of a small studio's product is uncertain. Teams that adopt Drumbeats are betting on its staying power.
For now, Drumbeats is a compelling option for developers who want to stop silent failures without the overhead of a complex monitoring stack. The heartbeat model is proven, the pricing is transparent, and the AI-native integration is a forward-looking touch. If it can maintain momentum and build trust, it could become the default choice for teams that want to know when their jobs don't run—before their users do.