Shielded
Shielded maps external shocks to your margins, starting with a spreadsheet export.
NewName Editorial
Editorial Team
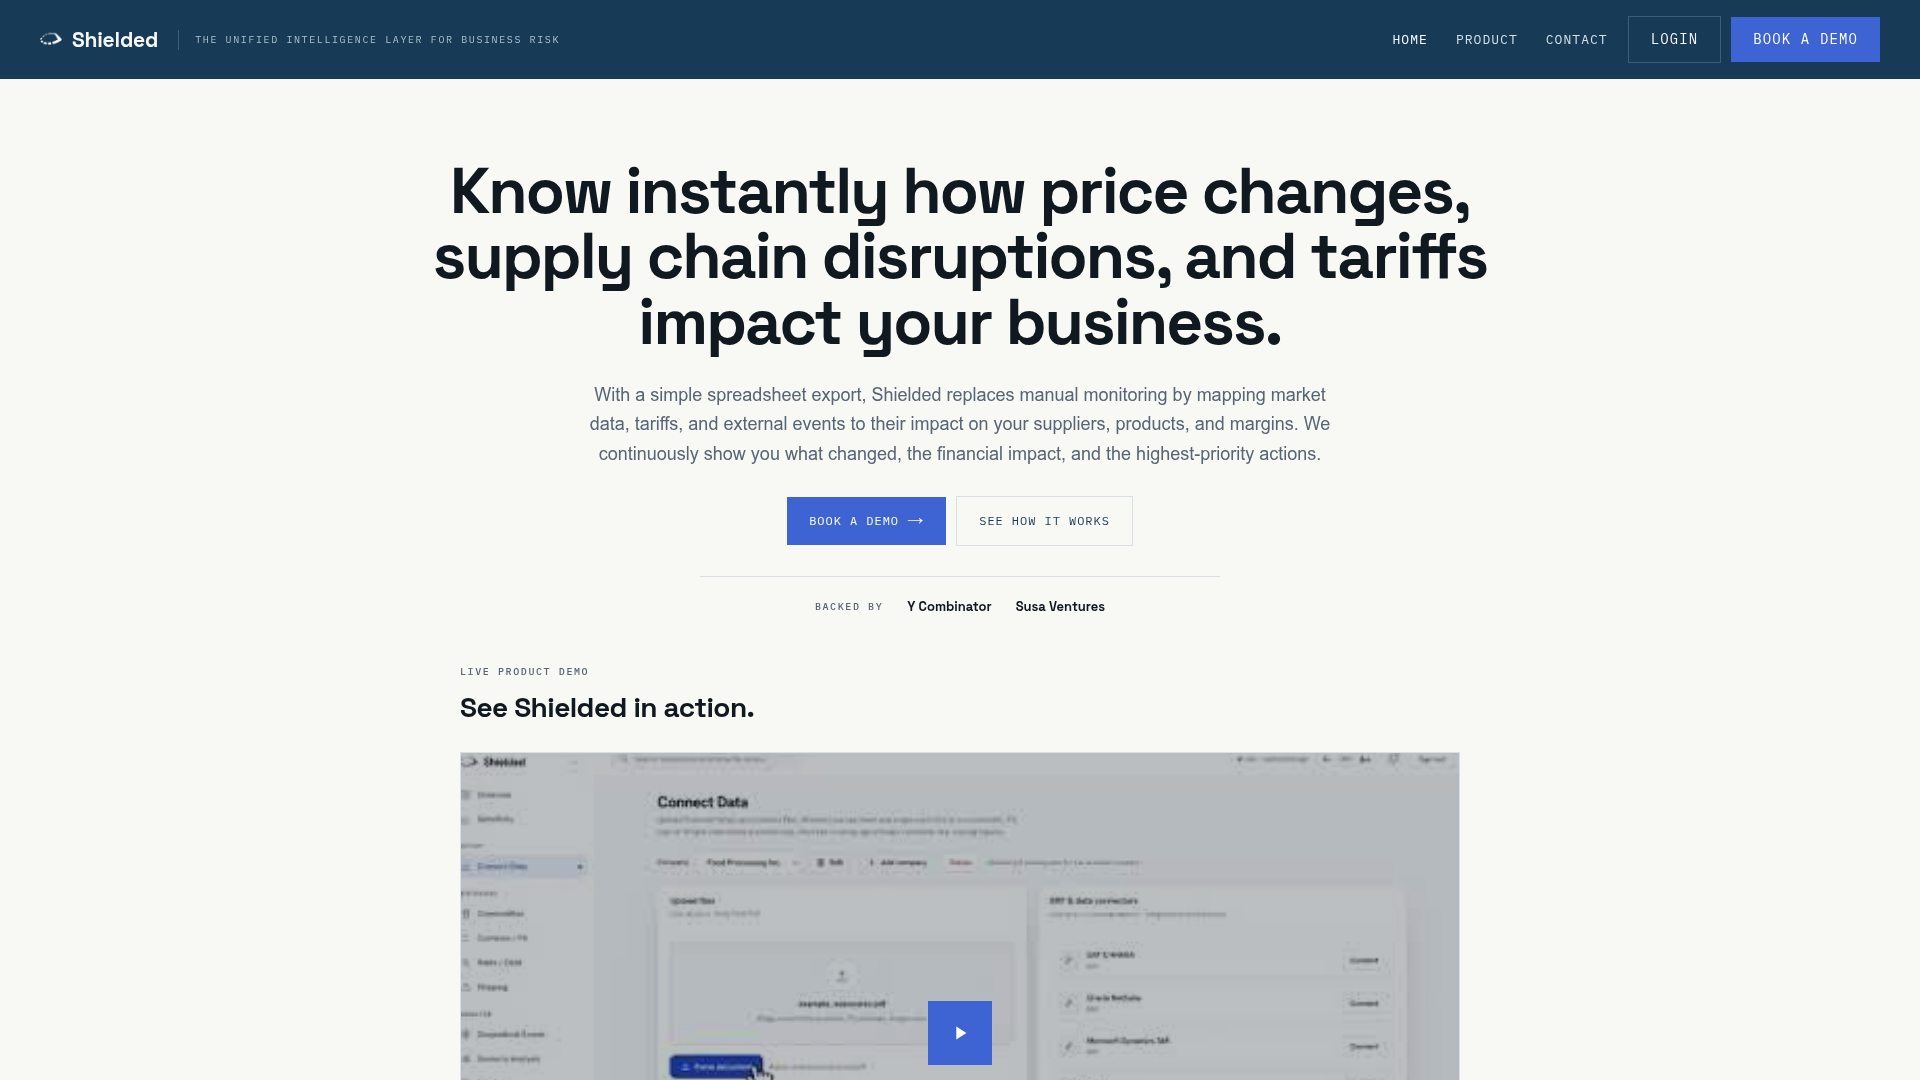
Supply chain risk management has a dirty secret: most tools show you the storm, but not the damage to your own ship. They track geopolitical headlines, commodity prices, and shipping disruptions in real time, but leave the hardest question unanswered—what does this mean for my purchase orders, my bill of materials, my margins? Shielded, a Y Combinator-backed startup, is built to answer that question with a mechanism that is both simple and subversive: it starts with a spreadsheet export.
The pitch, as stated on its site, is to "know instantly how price changes, supply chain disruptions, and tariffs impact your business." The company calls itself "the company brain for supply chain risk," and its product is a unified intelligence layer that maps external events to internal financials. But the real story is not the ambition—it's the entry point. Shielded does not ask you to rip out your ERP or build a data warehouse. It asks for a spreadsheet. That choice reveals a sharp thesis about why previous risk tools have failed, and it's worth examining closely.
Why supply chain risk tools fail at the margin line
The typical supply chain risk platform is a monitoring dashboard. It ingests news feeds, weather data, and shipping indices, then presents a heat map of global threats. The implicit assumption is that a risk manager will see a red flag and somehow translate it into action. But that translation is where the value is lost. A procurement director does not need to know that copper prices rose 15%—they need to know that a specific component in a specific program just got $3.7 million more expensive, and that the margin on that program will shrink by 0.4%.
Shielded's website makes this pain point explicit. The product is not positioned as a monitoring tool but as a "unified intelligence layer" that "maps market data, tariffs, and external events to their impact on your suppliers, products, and margins." The key word is "maps." The company's value proposition is not the data—it's the connection. The live model on the homepage demonstrates this: select a tariff on Mexican imports, and the system calculates an annual operating impact of −$12.8M, a −3.4% margin hit, and a 34% risk coverage. It breaks down the impact by duty on finished goods, cross-border components, and customs brokerage, and even factors in USMCA exclusion eligibility. That is the kind of specificity that a generic risk feed cannot provide.
The spreadsheet export as a Trojan horse
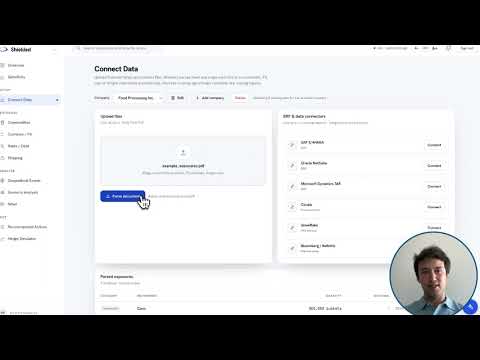
The most interesting product decision is the onboarding mechanism. Shielded's homepage states: "With a simple spreadsheet export, Shielded replaces manual monitoring by mapping market data, tariffs, and external events to their impact on your suppliers, products, and margins." This is a deliberate contrast to the enterprise software playbook of requiring deep integrations. Instead of a six-month implementation with a data team, Shielded asks for a file that most companies already have on hand.
The spreadsheet export is a Trojan horse for two reasons. First, it lowers the barrier to entry. A procurement lead can export a bill of materials or a supplier list from their ERP, upload it to Shielded, and get immediate visibility. This is a wedge that bypasses IT departments and data governance committees. Second, it forces the product to be useful with imperfect data. A spreadsheet is a snapshot, not a live feed. Shielded's promise to "continuously show you what changed" implies that it can enrich that snapshot with external data and then update the impact as events unfold. The spreadsheet is not the end state—it is the starting point for a living model.
This approach is also a bet on the buyer. Shielded is not selling to the chief risk officer who wants a dashboard; it is selling to the operations or finance leader who wants to know if a tariff will blow a hole in next quarter's margin. The spreadsheet export is a signal that Shielded understands the user's workflow: they are already working in spreadsheets, and they need answers, not more data.
From tariff headlines to dollar figures: the live model
The live model on Shielded's homepage is the clearest demonstration of its value. It lets you select an event—a 25% tariff on Mexican imports, a 15% copper price increase, a Red Sea shipping disruption, a stronger dollar, or a 30% cocoa price jump—and see the annual operating impact. The numbers are illustrative, but the logic is the product. The model breaks down the impact into categories like "Duty on finished goods" and "Cross-border components," and it accounts for mitigating factors like "USMCA exclusion eligibility." It even suggests a recommended action: "Re-source affected SKUs to domestic suppliers and refresh list pricing before the effective date."
This is not a static chart. The model implies a dynamic engine that connects external events to internal cost structures. For a manufacturer, that means understanding how a tariff on steel affects the cost of a purchased part, which affects the margin on a program, which might trigger a price increase to a customer. For a food and beverage company, it means tracking a cocoa price spike to the landed cost of a specific SKU and its gross margin. The website lists these use cases explicitly: tariff exposure by supplier, bill of materials cost changes, program margin impact, ingredient cost exposure, landed cost by SKU, and gross margin impact.
The breadth of industries—manufacturing, defense, food and beverage, transportation and logistics—suggests that Shielded is building a generalizable engine. The common thread is that all these industries have complex, multi-tier supply chains where external shocks are frequent and margin impact is non-obvious. The live model is a proof of concept that Shielded can handle the complexity, but it also raises the question of how deep the data integration goes. The website mentions "22 sources" in the demo, but it does not specify what those sources are or how they are weighted.
The pilot-first pricing strategy
Shielded's pricing page reveals a go-to-market strategy that is unusually cautious for a startup. The free "Advisory" plan is a guided pilot with limited features: up to 5 tracked events, portfolio exposure analysis, event catalogue and tracking, probability charts and alerts, and AI-powered onboarding. The "Platform" plan, which is marked as "Most Popular," requires contacting sales for pricing and includes unlimited tracked events, real-time probability tracking, supply chain risk mapping, a scenario builder with saved views, hedge recommendations, API access, and team management.
The pilot-first approach is smart because it aligns with the product's complexity. Shielded is not a self-serve tool; it requires onboarding and customization to map a company's specific suppliers and products. A guided pilot lets Shielded demonstrate value in a controlled environment, and the free tier acts as a low-risk entry point. The pricing page also mentions "AI-powered onboarding," which suggests that the company is using AI to accelerate the mapping process—another reason why a spreadsheet export might be sufficient to start.
However, the lack of published pricing for the Platform plan is a double-edged sword. It signals that the product is enterprise-grade and tailored, but it also creates friction for a potential buyer who wants to evaluate cost before committing to a demo. The "Book a Demo" call-to-action is everywhere, which is typical for B2B SaaS, but it means that the real product experience is gated behind a sales conversation.
What Shielded still doesn't show
The website is compelling, but it leaves several questions unanswered. The live model is a demo, not a real customer example. There are no case studies or testimonials, and the site does not disclose which companies are using the product. The "22 sources" in the demo are not enumerated, and the methodology for calculating financial impact is not explained. For a product that promises to quantify risk, this lack of transparency is notable.
There is also the question of data accuracy. A spreadsheet export is a point-in-time snapshot, and the external data sources are constantly changing. Shielded's promise to "continuously show you what changed" implies a real-time data pipeline, but the website does not detail how it handles data freshness or how it deals with missing or incomplete supplier data. The risk is that the model produces precise-looking numbers that are based on assumptions the user cannot verify.
Finally, the brand name "Shielded" is a double-edged sword. It evokes protection and defense, which is appropriate for a risk management product, but it is also generic. There are many companies with "shield" in their name, and the word does not differentiate Shielded from competitors. The tagline "The company brain for supply chain risk" is more distinctive, but it is a bold claim that the product must live up to.
Despite these gaps, Shielded's core insight is valuable: the value of risk intelligence is not in the data, but in the connection to financial outcomes. By starting with a spreadsheet export and focusing on margin impact, Shielded is attacking the problem from the right angle. The question is whether it can deliver on the promise of a "unified intelligence layer" without requiring the very data infrastructure that most companies lack. The pilot-first pricing and the AI-powered onboarding suggest that Shielded is aware of this challenge. For now, the product is worth watching—and the demo is worth booking.